Measuring Performance
If you think about the purpose, “I want it to learn fastest”, the basic measure is time (quicker==better). We don’t record time per se but are recording the “epoch” (generations to train) and given each epoch is a tick of a timer, that is ultimately relative to time.
However, there are qualitative considerations we could apply. Not all results are equal…
vs.
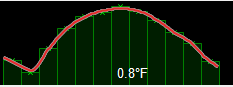
vs.
Which is better? Herein lies a challenge – measuring overall performance.
- Do I build a function that analyses the smoothness of the curve?
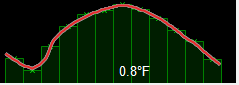
- Does the first or second image closely match the temperatures recorded?
We only have one value per month, and no interim data points, which means it is difficult to know with any certainty. All we can measure is for any given month whether it matches the known value, we can’t check any points in between due to the absence of data.
An improvement would be to have the month, and mid-month values, then train on the month value whilst checking accuracy on the mid-month (that it wasn’t trained on).
The third with a spike looks wrong, but maybe the real temperatures that year did indeed spike rather than curve.
You need to think about aspects like this. I would want more data points if my life depended on it.
ADAM and dynamic learning rates are meant to improve the learning rate
Please note: the graphs are ranked based on their temperature average across all 12 months. So when one is higher ranked but appears to have the same temperature, it’s because it was lower but is the same after rounding to 1 decimal place.
The example below was run for 50,000 epochs, what we observe is somewhat alarming – one of the ADAM graphs did worst of all (rank 36). It got stopped for an error of over 200 degrees. It might have reduced during subsequent epochs or blown up (the network weightings can grow huge).
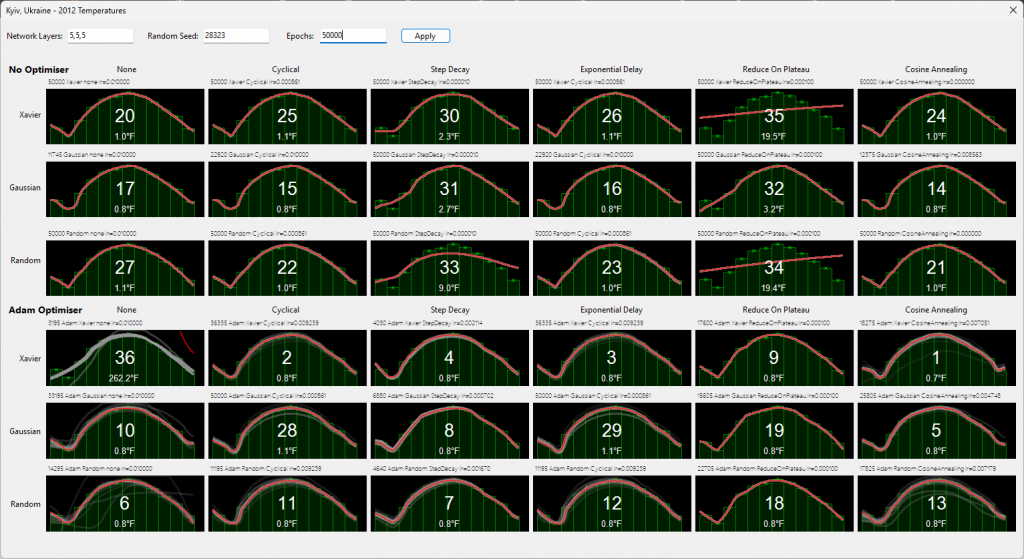
Let’s think about #34, and 35, neither appear to have made an effort to converge, despite having Xavier / Random with “Reduce on Plateau”. They did worse than NO optimisations whatsoever.
At 5000 epochs rather than 50k, they scored as follows, different “best”, which then gives a dilemma. Do I pick the first to meet the minimum threshold, or do I wait for more epochs to train a better one?

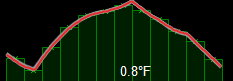
In the following example, you can see the “oscillations” that arise using ADAM or learning rate techniques.
That led me to rethink the best approach, to expect “n” readings all below the threshold. You will find it can oscillate and reach the threshold, but the next epoch misses it by a wide margin, a few epochs later it’s back on track.
Oscillations in neural networks occur because each time we train it moves levers (weights/biases). Unfortunately, when you push one lever, despite ADAM and learning rates, it tends to ruin something that was previously correct, but over time, it generally manages to reach equilibrium.
ADAM tries to minimise that, by pushing the most critical levers. It still doesn’t directly converge.
Which do you think is consistently best?