In the beginning, there was one big log file.
And although it technically worked, it was also Ctrl‑F‑ing annoying — the software‑engineering equivalent of trying to find a specific grain of rice in a bucket of couscous. Every time something went wrong (which was often, because early‑stage AI systems behave like caffeinated toddlers), I’d scroll, squint, and mutter things that would get me banned from family WhatsApp groups.
I didn’t start this project with a grand observability strategy. There was no whiteboard session, no architectural diagram, no “industry best practice”. It was more: build something, discover pain, patch pain, discover new pain, repeat. A very educational process, in the same way that touching an electric fence is educational.
And then came the weekend that nearly made me give up on coding tools entirely.
GitHub Copilot — bless its synthetic heart — decided to “help” by generating code that behaved like an intern who’d cut snippets out of magazines and glued them into my repo. It spent two days burning tokens like a Victorian factory furnace, trying to work out what went wrong from the log, and me, whether I could sue it for emotional distress.
One log file clearly wasn’t enough. So I split them. One per step. Markdown here, JSON there. VS Code tabs everywhere. It felt organised… until I actually tried to use it.
My WinForms LLM Debugger app helped for a while — little boxes of captured steps, neatly arranged like a tiny AI dollhouse — but I still found myself diving back into the files. The observability system was growing, but only in the way a teenager grows: taller, messier, and still incapable of doing the dishes.
Eventually I accepted the truth: more of the same wasn’t going to fix anything. I needed observability that didn’t require spelunking through logs like a cave diver.
So I bit the bullet and moved everything to Postgres.
Asynchronous writes, structured columns, token counts, timestamps, redaction, the whole shebang. Observability became a proper grown‑up subsystem instead of a pile of text files held together by hope and caffeine.
And once the data was structured, the fun began.
The CLI Phase (a.k.a. 1980 Called and Wants Its Workflow Back)
After migrating to Claude, I leaned into skills. Claude built me a CLI — because if you’re going to automate your pain, outsource it to an LLM — and suddenly I could query sessions, drill into events, and inspect steps without writing SQL.
obs-cli sessions --last 1obs-cli session session-xyzobs-cli event 123
It worked beautifully. But it was still a CLI. And it’s 2026. I shouldn’t be living like a mainframe operator.
The Dashboard Era (Civilisation Returns)
So I built a dashboard.
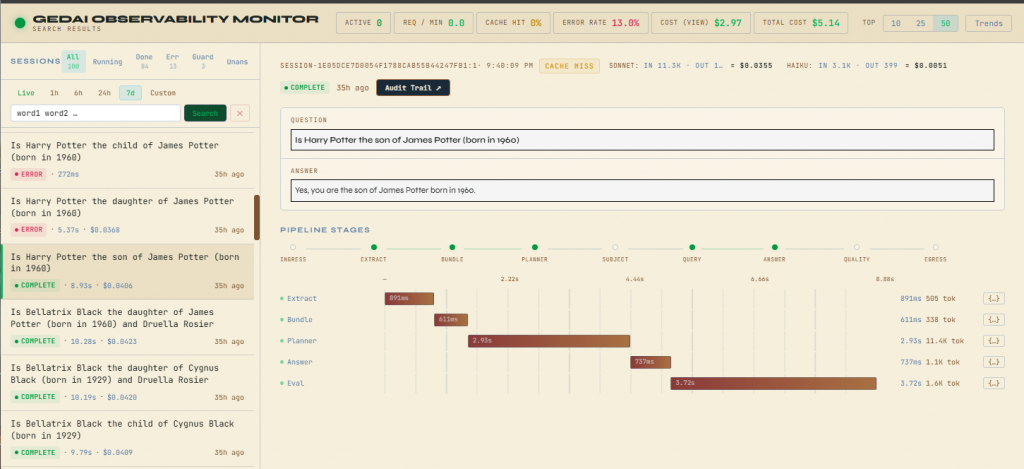
Note: Data is from the test suite – it intentionally doesn’t PII redact those.
Real‑time question flow. Step breakdowns. Token burn. Loop flattening. Redaction indicators. Filters for failures. Drill‑downs that show everything a regulator would want to see — even though genealogy doesn’t have a regulator. (Yet. Give it time. Someone will eventually decide that second cousins need compliance frameworks.)
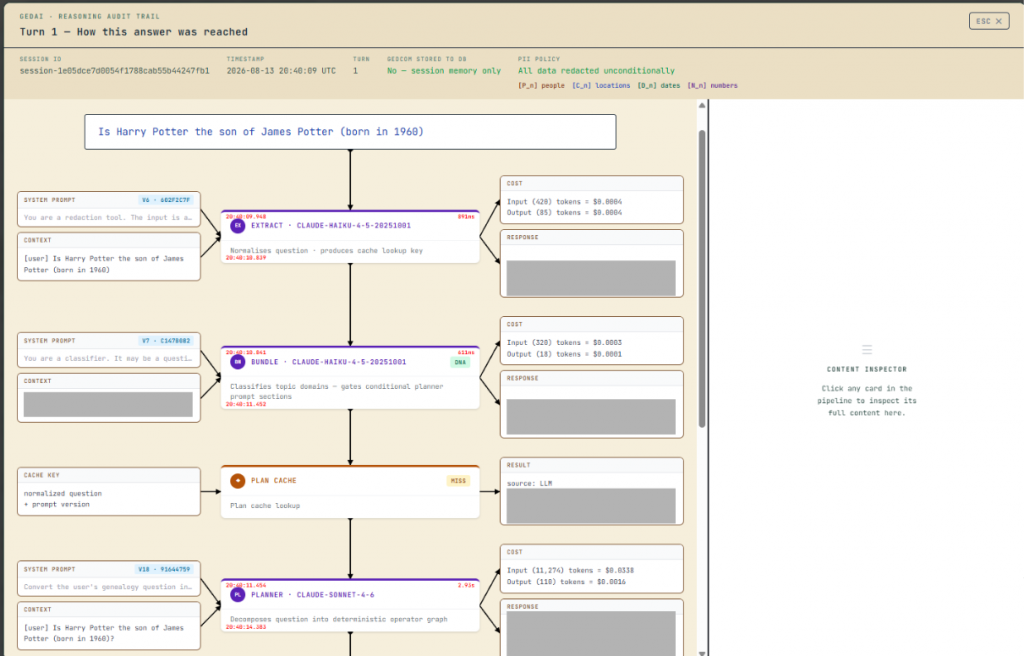
The dashboard isn’t my core IP. It’s just the thing that lets me sleep at night. And if you’re building anything with multiple LLMs, you should absolutely build one too.
Here’s what you actually need:
1. Granular observability
Instrument every step. Capture inputs, outputs, timings, token burn, model version, prompt version, and anything else that helps you understand “why did this thing do that”.
2. Redaction
If you store PII, you inherit risk. If you leak PII, you inherit consequences. Redact early, redact consistently, redact automatically. Even internal systems deserve respect.
3. A clear objective
Don’t build observability because it’s fashionable. Build it because you need to answer specific questions:
- Why did the model choose this path?
- What did it see?
- What did it ignore?
- Where did it fail?
- How expensive was the failure?
Claude (or any LLM) can only help if you know what you want out of the data.
4. A secure place to put it
Internal web server. Authentication. mTLS if you’re fancy. Lock it down. Observability is a goldmine for attackers.
5. A data lifecycle
Keep everything forever? Maybe. But storage costs money, and old observability data is basically AI compost. Decide what you purge, when, and why.
Once you’ve got the basics, design the dashboard around purpose, not features. A dashboard is not a museum. It’s a tool.
Costing: The Part Where I Become a Token Accountant
Every LLM call in my system is logged and costed. Every. Single. One.
Not because I’m tight, but because token burn is the closest thing AI has to a utility bill. If you don’t track it, you’ll eventually wake up to a surprise invoice that makes you reconsider your life choices.
My dashboard shows:
- cost per call
- cost per session
- cost per hour
- cost per day
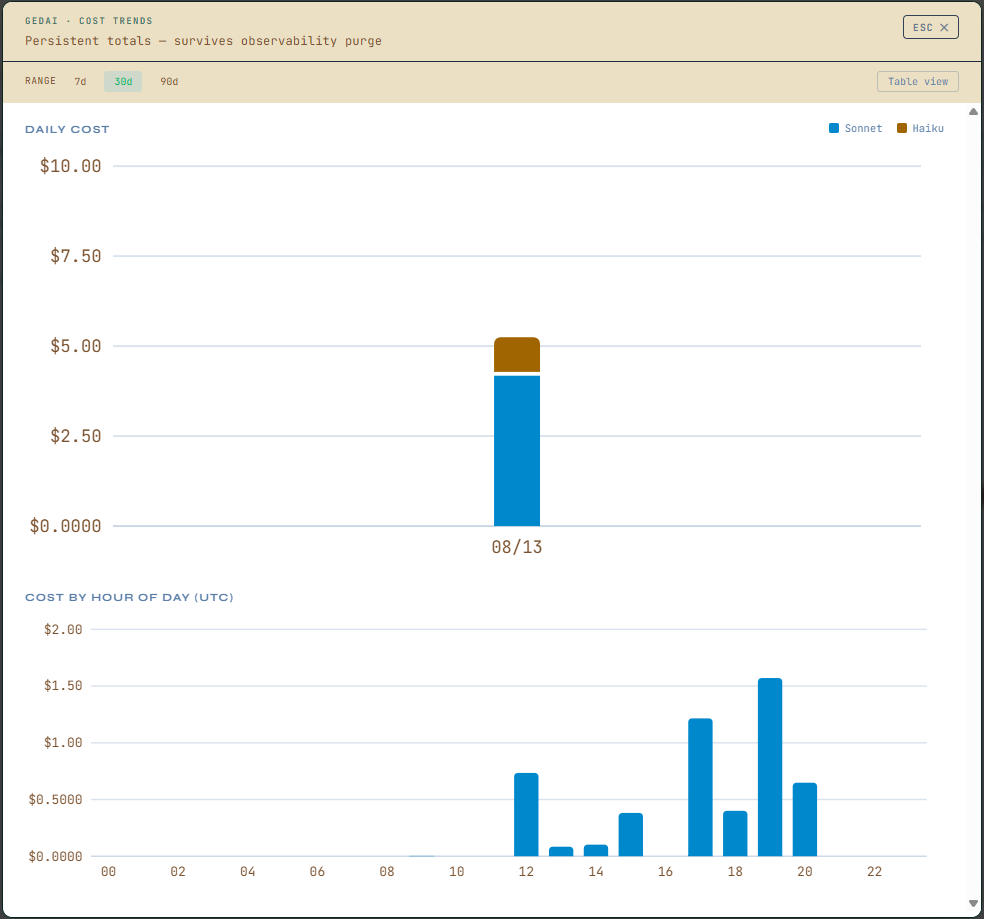
Quiet periods become upgrade windows. Spikes become warnings. And when the token budget dips, I get alerts — because nothing says “bad day” like your system silently hitting quota mid‑inference.
Costs live outside observability so they survive purges. Observability is ephemeral; money is not.
So What Should Readers Take Away?
Not “Dave built a dashboard”.
But:
- Observability is not optional in multi‑LLM systems.
- Logs are fine until they aren’t.
- Structure beats text.
- Redaction beats regret.
- Dashboards beat CLIs.
- Costing beats bankruptcy.
- And if you don’t build this early, you’ll eventually build it late — and late hurts more.
If you want to plagiarise anything, plagiarise the principles, not the implementation. My dashboard is just one expression of a universal truth:
AI systems behave strangely. Observability is how you catch them in the act.